Monday, May 26, 2014

Load Testing - 10 Points to remember

Introduction

Most of the software companies are running Load Testing on their products. Load testing is one of the most important testing types today. On the 6/6/2008 Amazon web site crashed for two hours, it would have been difficult to calculate the exact amount that outage would cost Amazon, because customers could come back later for purchases but the stock closed down 4.6 percent at $80.63. Everyone thought "They know how to handle load".
In this article, I'm not going to talk about Load Testing tools or advanced testing techniques, but rather, I would like to talk about 10 basic steps that are the foundations for creating a good, precise and powerful Load Test suite.

Step 1 - Identify Objectives

The purpose of this step is to identify and write the performance objectives of your application. The key question you should ask yourself is: 
“How should my application behave under load?”

The main parameters we should consider are:
Response time - The time that would take the application to display a certain output or perform a certain calculation. Example: the product catalog must be displayed in less than 3 seconds.
Throughput – The rate of successful message delivery over a communication channel. Example: the system must support 100 requests per second.
Resource utilization- A frequently overlooked aspect, Resource Utilization defines how much resource your application is consuming, in terms of CPU, memory, disk I/O, and network I/O.
Maximum User Load- Determine how many users can run on your testing hardware configuration.
This is probably the most important step!

Step 2 - Identify Key Scenarios (or profiles)  

what are scenarios?
Scenarios are anticipated user paths that generally incorporate multiple application activities.
How do you identify scenarios?
Key scenarios are those for which you have specific performance goals or those that have a significant performance impact. These scenarios represent business activity of users over time.
For example: Open 'about window' will take less resource than perform 'buy' action.
The “Buy” action, as opposed to “Open about window”, will involve multiply actions like: SQL, Credit Card validation, IIS 

Step 3 - Identify the workload

Identify the distribution / ratio of the work - For each key scenario, identify the distribution / ratio of the work. The distribution is based on the number of users executing the scenario (according to their profile).
For an existing application this information can be provided from IIS log/counters as described in step 1.
For a new application this information can be based on market research, historical data, market trends and prototypes.
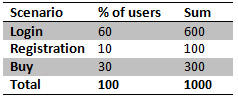
Calculate the users load per scenario - Based on the previous data; calculate the maximum possible concurrent users for the application. Using the work distribution for each scenario calculate the % user load per key scenario. For example, the distribution of load for key scenario could be similar to that shown in the following table. 
1.png

Step 4 - Identify Metrics

Metrics are a derivative of your performance objectives. They are used to measure your application’s real time performance in comparison with your performance objectives. In addition, they also help you to identify problems and bottlenecks within your application.
Network-specific metrics: This set of metrics provides information about the overall health” and efficiency of your network, including routers, switches, and gateways.
System-related metrics: This set of metrics help you identify the resource utilization on your server. The set includes CPU, memory, disk I/O, and network I/O metrics.
Platform-specific metrics: Platform-specific metrics are related to software that is used to host your application, such as the .NET Framework common language runtime and ASP.NET-related metrics.
Application-specific metrics: These include custom performance counters embedded in your application code that monitors the application’s “health”. You might use custom counters to determine the number of concurrent threads waiting to acquire a particular lock or the number of requests queued to make an outbound call to a Web service.
Service level metrics: Service level metrics can help to measure overall application throughput and latency, or they might be tied to specific business scenarios. 
2.png

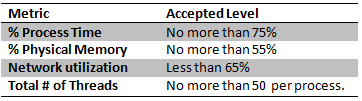
 Step 5 – Pick Load Test Tool

Before writing your Tests we need to pick the right load testing tool.
In order to select the proper tool for us and our application, we will need to perform a research; Load testing tools requires specific knowledge and each tool has his advantages and disadvantages.
Everyone can learn how to use a load testing tool, however, different tools are better for different purposes, selecting the right can have a significant impact on our testing process.
Most tools have very good functionality and advanced features. One of the first parameters you would use for comparison of tools is the user limit (or lack thereof) and the scalability of that limit. As a rule of thumb try to avoid tools that cap the amount of users simulated via licensing (More users = more money).
For example, Team System Test Edition has no User Limit, so we can simulate as many users as our hardware allows us to.
Personally, I'm using Microsoft’s Team System; if you have picked this tool you may contact me for assistance.

Step 6 - Create Test Cases

  • What is a test case?
    • A group of activities involved in a scenario/user profile.
    • The test cases are created based on the scenarios and the profile mix identified in the previous steps.
Each test case should include the expected results in such a way that each test case can be marked as a 'pass' or 'fail' after execution. 
Test Case: Search phone owner 
3.png 
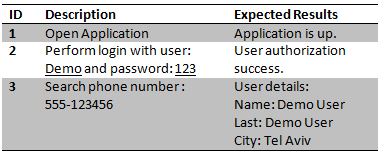
Create an automated test and set a specific load configuration for it.
Example: 400 users for 1 hour
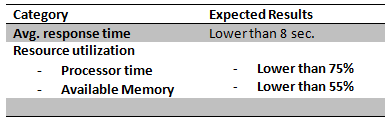
And load test expected results for Test Case: Search phone owner 
4.png

Step 7 – Prepare\Understand Your Load Environment

Our setup environment should duplicate the architecture of our production environment as closely as possible.
It is important to simulate the load on environment similar to our production because even the smallest hardware or configuration difference can have a big impact on our results.
Creating a testing environment which duplicates the production environment exactly can be hard and isn’t always feasible, but we need to do our best, because this environment will help us estimate the load results of our product.
We must understand the hardware limits of our environment and find the bottlenecks before starting the Test.
Example: I have created a load environment with 2 computers that will run 10,000 concurrent users, the ISP provides 1Mbps.
Each user will open browser and perform a search for dynamic word in 
www.live.com.
Opening 5000 browsers on one machine?
I've never tried it but I'm sure that CPU usage will be 100% for a while.
When CPU usage is 100% the computer is not creating the needed load and we will get false information so this is our first bottleneck.

Do you think 1Mbps is enough bandwidth for 10,000 users?
No! 10,000 users cannot work together on 1Mbps bandwidth, this is the second bottleneck. 

Step 8 – Run It Step by Step

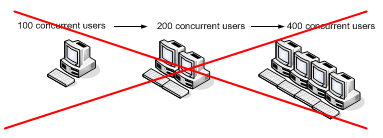
Begin load testing with small number of users distributed against the user profile, and then increase the load incrementally. It is important to have sufficient time between each step, so that the system has enough time to stabilize before the next set of user connections executes the test case.

Incrementing the number of users slowly will make it easier to find the exact point/threshold where the system crashes or hangs due to load. Starting the tests with a large number of simulated users will prevent us from detecting that point/threshold efficiently.
Run the load test in cycles. Each cycle should achieve a certain load increment, and should have analysis and fixing time in between. Check the metrics for each cycle, and document them, so you can show evidence that the loads was achieved already. 

Step 9 - Run

After successfully implementing step 8, the system is considered stable, and we can run the full Load Test as mentioned in the preplanned workload.
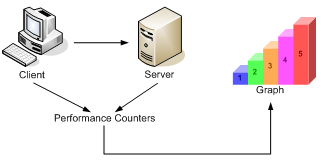
Before running the test we must make sure we are monitoring both the computer running the load test and the computer taking the load. This will help us find bottlenecks on both sides of the test.
Team System Test Edition can perform such dual monitoring.
If your load tool doesn't have this ability you can use Windows Performance Monitor (Perfmon), the disadvantage of using Perfmon is that you will have two or more separated  graphs you need to analyze. 
5.png

Step 10 - Analyze and Evaluate the Results

After each run, and of course after the full run, we analyze the results and check against the metrics and make sure our objectives were achieved.
We save each run Results and compare with other runs, in this way we may notice improvement or deterioration of the performance and load of your application.
Make sure you can share your load and performance test results and evaluations - performance and load testing is a serious discipline, but it also needs to be understood by other key business disciplines such as business operations, senior management and maybe finance.
Try to simplify things so it will be understood by those specific populations: It helps to have some kind of graphical reporting ability (in the tool) that allows us to share our test results with other parts of our organization.
My Rule is - The results from one environment aren’t necessarily equal to the results of another.
Can you say that 6.png I say maybe…
Example: Production environment has 10 computers and the Load environment has 2 computers, the load test showed that 2 computer can holds more the 1000 users, so 10 computer can holds approximately 5000 users? NO!
7.png
So why perform load testing if the results are inconclusive to production?

Load Test helps you to estimate the behavior of the application under load

Tuesday, May 20, 2014

Start with Jmeter

Jmeter Interview Questions

What is Jmeter?
JMeter is one of the Java tools which is used to perform load testing client/server applications
Apache JMeter is open source software, a 100% pure Java desktop application
designed to load test functional behavior and measure performance of the application.
It was originally designed for testing Web Applications but has since expanded to other test functions

What are the other applications tested by Jmeter? 
JMeter may be used to test performance both on static and dynamic resources (files, Servlets, Perl scripts, Java Objects, Data Bases and Queries, FTP Servers and more)
What do u sees when u opens a JMeter?
By default,
Test Plan
Workbench
Can be seen
What is Test Plan in Jmeter?
Test plan describes a series of steps JMeter will execute when run.
A complete test plan will consist of one or more Thread Groups, logic conrollers, sample generating controllers, listeners, timers, assertions, and configuration elements.

What is Work bench?
The Workbench is simply an area to store test elements while you are in the process of constructing a test. 
The Workbench is a sandbox for any test or portion of a test that you are working on.
When you are ready to test what you have designed in the Workbench, you can copy or move the elements into the Test Plan.

It also contains Non- Test Elements
Http mirror sever
Http Proxy server
which is not available in the thread group & Test plan

What is Thread Group?
Thread group elements are the beginning points of any test plan.
  1. All controllers and samplers must be under a thread group. 
  2. Listeners may be placed directly under the test plan, in which case they will apply to all the thread groups. 
  3. The controls for a thread group allow you to:
  • Set the number of threads
  • Set the ramp-up period
  • Set the number of times to execute the test 

What are the parts of thread group?
  • Sampler :Sends various types of requests to the server
  • Listeners : Results of the Run can be viewed & saved
  • Timer : Makes the run more realistic by inserting delays between the requests
  • Controller : responsible for controlling the flow of the thread group.If we have defined request to be executed on some logic like if-then-else or loop structure in java
  • Config Element: Info about the requests are added to work with samplers using this.
  • Assertion: To check if the responses are within given time and containing expected data
What are Controllers and its types? 
JMeter has two types of Controllers

Samplers Controllers 
Logical Controllers 

Samplers Controllers 
Samplers tell JMeter to send requests to a server.
For example, add an HTTP Request Sampler if you want JMeter to send an HTTP request. You can also customize a request by adding one or more Configuration Elements to a Sampler.

Logical Controllers 

Logical Controllers let you customize the logic that JMeter uses to decide when to send requests.
Logic Controllers can change the order of requests coming from their child elements.
For example, you can add an Interleave Logic Controller to alternate between two HTTP Request Samplers.

What is Configuration element?
A configuration element works closely with a Sampler
Configuration elements can be used to set up defaults and variables for later use by samplers.
Note that these elements are processed at the start of the scope in which they are found, i.e. before any samplers in the same scope.

Its elements:
CSV Data Set Config: Used to read lines from a file, and split them into variables.
HTTP Authorization Manager: You can specify one or more user logins for web pages that are restricted using server authentication
Java Request Defaults: You can set default values for Java testing
HTTP Cookie Manager: The Cookie Manager element has two functions: 
1.                  It stores and sends cookies just like a web browser.
2.                  Second, you can manually add a cookie to the Cookie Manager. However, if you do this, the cookie will be shared by all JMeter threads
HTTP Request Defaults: This element lets you set default values that your HTTP Request controllers use.
HTTP Header Manager: The Header Manager lets you add or override HTTP request headers

What are Listeners?
A listener is a component that shows the results of the samples
The results can be shown in a tree, tables, graphs or simply written to a log file
The Graph Results listener plots the response times on a graph.
The "View Results Tree" Listener shows details of sampler requests and responses, and can display basic HTML and XML representations of the response.
Other listeners provide summary or aggregation information.

Every listener in JMeter provides a field to indicate the file to store data to.
They also provide means to view, save, and read saved test results.

Ques. Is the url in question. While I (think) I understand what this url is doing, what are my steps to test in JMeter? Any help appreciated.

Ans. The steps to test in Jmeter depend largely on what you're trying to test.
As a starting point, I would recommend recording logging into the site, so you capture every parameter that's being sent along with its value.You can then parametrize these values as needed. It looks like once someone logs in, they get redirected to another page. Mostly likely when you record, you'll see the login page and then a landing page captured.appreciate the response. what is happening is i am going from a somesite.com, click login, which directs to Subdomain.somesite.com/users/sign_in/service:accounts?redirect=/ at which point you enter credentials and goto subdomain.somesite.com/. In fiddler, the result is to goto root of subdomain.somesite.com, so that is working. The next question would be how to record in JMeter the request 'subdomain.somesite.com/users/sign_in/service:accounts?redirect=/' Is it an http Request that I track, is it broken up and the path added in the path field, how is the ':' handled... thanks for insight .
When you record it, JMeter will automatically capture all the redirect pages and sub domains. Most likely the redirect will be an HTTP Request to "/users/sign_in/service:accounts" with parameter for redirect with value
Performance testing is an important process of any software development. Even though these are not common interview questions for Java developers, you can bring it up yourself to many open-ended questions. Setting up a performance/load test script is always the first step in fixing non-functional and hard to reproduce issues relating to memory leaks, database deadlocks, thread-safety,  CPU usage, excessive disk I/O, etc. 

Q. How did you go about fixing a performance issue?
A. Set up
 JMeter to reproduce the production like scenario to put through concurrent requests and put the system under heavy load. Used a profiling tool to monitor CPU times, memory usage, etc.

Q.
 What are some of your recent accomplishments?
A.  Reduced the response time from 4 seconds to 2 seconds. Set up
 JMeter to put the system under peak load. Used a profiling tool to monitor CPU times, memory usage, etc. Identified the bottle neck, and improved the situation by fixing the offending database connection leak, back tracking regular expression, and a badly constructed SQL query with Cartesian joins. 

Q.
 How would you go about writing a JMeter based performance test case for the following scenario?

·                     XML/HTTP based RESTful Web Service calls are made against an order execution system. The system should be able to handle a basic load of 30 orders per 3 min. There will be 30 concurrent users. This means 600 orders per minute.
·                     The test case should simulate at least 2 different account ids.
·                     30 orders per 3 min x 60 minutes = 600 orders per hour.

A.
 The JMeter version 2.4 is used for the following screenshots. The number of artefacts shown for this are as shown below.

STEP 1: Relevant files.


·                     OrderExecution.jmx is the JMeter script.
·                     1-OrderRequest.xml and 2-OrderRequest.xml are the two sample XML payloads that will be sent via an HTTP POST (RESTful Web service).
·                     TestData.csv is a data file used for retrieving values 1 & 2 to switch between 1-OrderRequest.xml and 2-OrderRequest.xml to simulate 2 different accounts.

1-OrderRequest.xml

1
2
3
4
5
6
<?xml version="1.0" encoding="UTF-8"?>
<OrderRequest>
    <accountId>12345</accountId>
    <quantity>150</quantity>
    <unitPrice>12.50</unitPrice>
</OrderRequest>

2-OrderRequest.xml
1
2
3
4
5
6
<?xml version="1.0" encoding="UTF-8"?>
<OrderRequest>
    <accountId>6789</accountId>
    <quantity>200</quantity>
    <unitPrice>6.50</unitPrice>
</OrderRequest>

TestData.csv
1
2
1
2
STEP 2: JMeter scripts

If you open the OrderExecution.jmx script file, you will see something like this.
 

Lets' go through each of the elements.
 Thread Groups are equivalent of virtual users in other performance testing system. You can add this element by right clicking on the test plan and then selecting Add --> Threads (Users) --> Thread Group. As per the requirements, the system should handle 30 concurrent users. The ramp up time is 180 seconds, which is 3 minutes. All 30 threads will get started in 3 minutes. The loop count is set to 20, to produce 600 orders (i.e. 30 threads * 20 loops) . 
It is a good practice to define some variables as shown below, so that these variables can be used in downstream elements without having to hard code. If you want to run against a different host, you can just change it in spot as opposed to having to change it in a number of places. You can add this by right clicking on "Order Processing" and then selecting Add --> Config Element --> User Defined Variables.
The CSV Data Config is a very useful element to read test data from CSV file and then save the read values into some variable. In this example, the values 1 and 2 are read from the file TestData.csv, and stored in a variable named "account". The one iteration will set account to 1, and the next iteration will set it to 2, and then the same assigment repeats since "recycle on EOF" is set to true.


The HTTP Header manager sets the HTTP headers. In this example, the content type is set to application/xml because we are posting the XML files 1-OrderRequest.xml & 2-OrderRequest.xml 
The HTTP request defaults sets the default values so that you don't have to repeat it in each request. Also, note that the user defined variables in the first step are used within ${} as opposed to literal values. 

The loop controller can be added to loop through the samplers a number of times. In this example, it is set to 1. 
The samplers can be added by right clicking on the "Create Order" loop controller and then selecting Add --> Sampler --> HTTP Request. It shows the path, method, and the file to send. The actual RESTFul web service call will have the URL
1
http://localhost:8080/myapp/executionservices/execution/1.0/order/create
Also, note that in the File Path the ${DATA_PATH} is a user defined value, and ${account} is a variable that is assigned from the TestData.csv file via the CSV Data Config element. The account will be dynamically changed between 1 and 2 to retrieve the files 1-OrderRequest.xml and 2-OrderRequest.xml respectively for each iteration. 

JMeter supports a number of samplers like SOAP request, FTP request, JDBC request, JMS publisher, JMS subscriber, etc to name a few. 
The
 XPath assertions are used to assert the response for presence of responseCode="SUCCESS" and a valid orderId > 0. The response message will look like
1
2
3
4
5
<?xml version="1.0" encoding="UTF-8" standalone="yes"?>
<OrderResponse>
   <orderId>50045671</orderId>
   <responseCode>SUCCESS</responseCode>
</OrderResponse>
The other three elements are reporting elements. There are many reporting elements to choose from depending on the requirements. You can add reporting elements via Add --> Listener.
Finally the Gaussian Timer that will delay the execution by 3 minutes (i.e. 180000 ms) with a standard deviation of 10 seconds. This will ensure the throuput of 30 orders per 3 minutes. 
Q. How would you go about automatically recording the your browser actions into JMeter?
A.
 This can be achieved 2 ways.
Use
 BadBoy, which is a tool to record your Web interactions.The  recorded script can be exported as a JMeter file with the extension .jmx to be imported into JMeter. The generated script will not be pretty, but it can be cleaned up and further extended within JMeter with user defined variables,  CSV data config, HTTP defaults, etc. You can record the script as you use your application.

    
·                     Use JMeter as an HTTP proxy server to record your browser actions.Firstly, set up your JMeter to act as a proxy server on an available port like say 9090 as shown below.
  Configure the proxy server as shown below:
·                     Port: 9090
·                     Target Controller indicates where to record. In the above diagram indicates to capture it in the WorkBench under the proxy server itself. This allows you to later on move the captured elements one by one into the TestPlan
·                      You don't want to capture everything. So, filter it with include and exclude patterns. For example,  Include: .*myapp.*, Exclude: .*\.jpg. 
·                     "Start" the proxy server.
You need to set up your browser to use this proxy server.
Finally, start using the browser to record your actions. For example, you could use the following URL
http://myhost:7001/myapp/home
 
Note: If you use
 localhost instead of myapp as the host, JMeter may not record your actions. To overcome this, type ipconfig on your DOS prompt and copy the local IP address and use that instead of localhost in your URL.
Q.
 What are Pre-Processor and Post-Processor elements?  In what order does JMeter process various type of elements?
A. A
 Pre-Processor executes some action prior to a Sampler Request being made. If a Pre-Processor is attached to a Sampler element, then it will execute just prior to that sampler element running. A Pre-Processor is most often used to modify the settings of a Sample Request just before it runs, or to update variables that aren't extracted from response text.
A
 Post-Processor executes some action after a Sampler Request has been made. If a Post-Processor is attached to a Sampler element, then it will execute just after that sampler element runs. A Post-Processor is most often used to process the response data, often to extract values from it.
A
 Regular Expression Extractor can be used as a Post-Processor element to extract values to be used elsewhere in subsequent requests. For example, if you are using JSF and Seam frameworks, the jsfViewState and CID values can be extracted as shown below:
The elements are executed in the following order as per the JMeter documentation.
0. Configuration elements
1. Pre-Processors
2. Timers
3. Sampler
4. Post-Processors (unless SampleResult is null)
 
5. Assertions (unless SampleResult is null)
 
6. Listeners (unless SampleResult is null)
Timers, Assertions, Pre- and Post-Processors are only processed if there is a sampler to which they apply. Logic Controllers and Samplers are processed in the order in which they appear in the tree. Other test elements are processed according to the scope in which they are found, and the type of test element.
 
Q.
 What are some of the challenges you faced with JMeter?
A.
If a subsequent request rely on the cookie set by the previous request, the "cookie manager" element is required.
 When setting up the "CSV Data Set Config", don't have any spaces in the variable names.
Q. Have you used any features of JMeter that gave you greater flexibility?
A.
 Yes. The JMeter supports BeanShell scripting for greater flexibility. The BeanShell is a small, free, embeddable Java source interpreter with object scripting language features, written in Java. 
If you want to output all the order ids extracted out of the response messages for the response messages shown below
1
2
3
4
<OrderResponse>
<orderId>50013914</orderId>
<responseCode>SUCCESS</responseCode>
</OrderResponse>
?
1
  
An XPath Extractor can be used to extract the "orderId" from the response message and store it in a variable named "orderId" as shown below.

Now, the
 BeanShell PostProcessor can use the extracted "orderId" variable and write to a file (e.g. C:\\Temp\\order-processing\id.txt ) as shown below.

You could do a lot more powerful things by writing your own embedded scripting with the BeanShell. For example, You can create your own file named MyBeanShell.bshr and copy it to $JMETER_HOME\bin folder. The MyBeanShell.bshr will have functions like
 
?
1
2
3
4
5
6
7
8
9
10
11
12
13
14
15
16
getReportStartDate()
{

 import java.text.SimpleDateFormat;

 cal = Calendar.getInstance();
 cal.add(Calendar.DATE, -10);
 sdf = new SimpleDateFormat("dd-MMMM-yyyy");
 return sdf.format(cal.getTime());
  }
 isTenth(int loopCounter)
{
  returnValue = false;
 if (loopCounter % 10 == 0)
 {
 returnValue = true;
 }
 return returnValue;
}
You could invoke these functions from your JMeter elements like
${__BeanShell(return getReportStrtDate();)}
Also, note that pre-defined functions like  __time can be used  as shown above. There are also handy JMeter plugins from Google code at http://code.google.com/p/jmeter-plugins/ containing useful functions, listeners, samplers, etc. Just download the zip file and extract the "JMeterPlugins.jar" into $JMETER_HOME\lib\ext folder. This plugin features are prefixed with jp@gc.
Finally, instead of BeanShell or simple functions out of the box like __time, you could also write your own Java based custom functions using theorg.apache.jmeter.functions.Function
 interface by writing your function  as described here http://gabenell.blogspot.com/2010/01/custom-functions-for-jmeter.html.
Q.
 How do you ensure re-usability  in your JMeter scripts?
A.
 
Using config elements like "CSV Data Set Config", "User Defined Variables", etc for greater data reuse.
·                     Modularizing shared tasks and invoking them via a "Module Controller".
·                     Writing your own BeanShell functions, and reusing them.